Legal Department
Storytelling Through Legal Analytics
Storytelling through legal data analytics can be extremely powerful. Automated intelligent insights power a Legal Department with stories for...

If a picture tells a thousand words, then an interactive legal dashboard can surely do the same. The work of a Legal Department involves the complexities of law, influenced and implemented by the most unpredictable and unquantifiable of things: people!
Can you capture the nuances of legal work in a single dashboard? Yes.
Can the legal dashboard communicate work to a non-legal audience? Yes.
Can you derive key insights to drive Legal Department decision making? Yes.
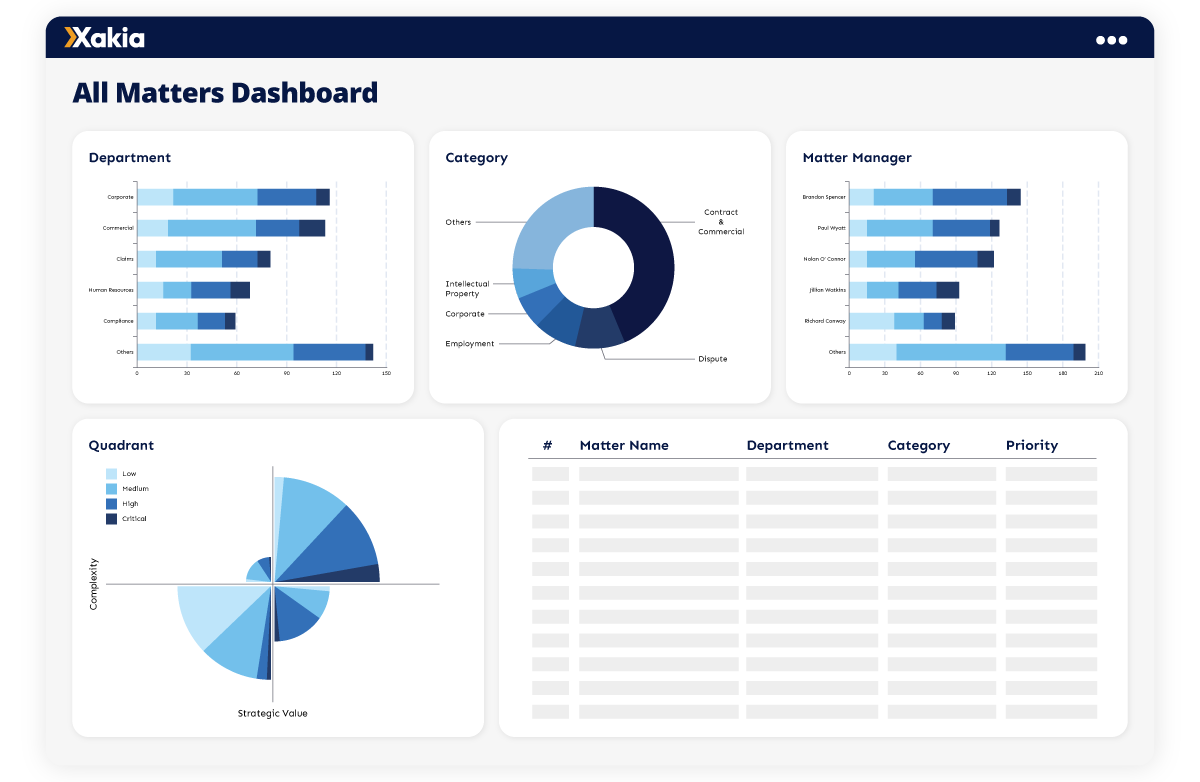
An In-House Legal Department dashboard should communicate seven key metrics:
Who is requesting the legal work?
What is the legal work?
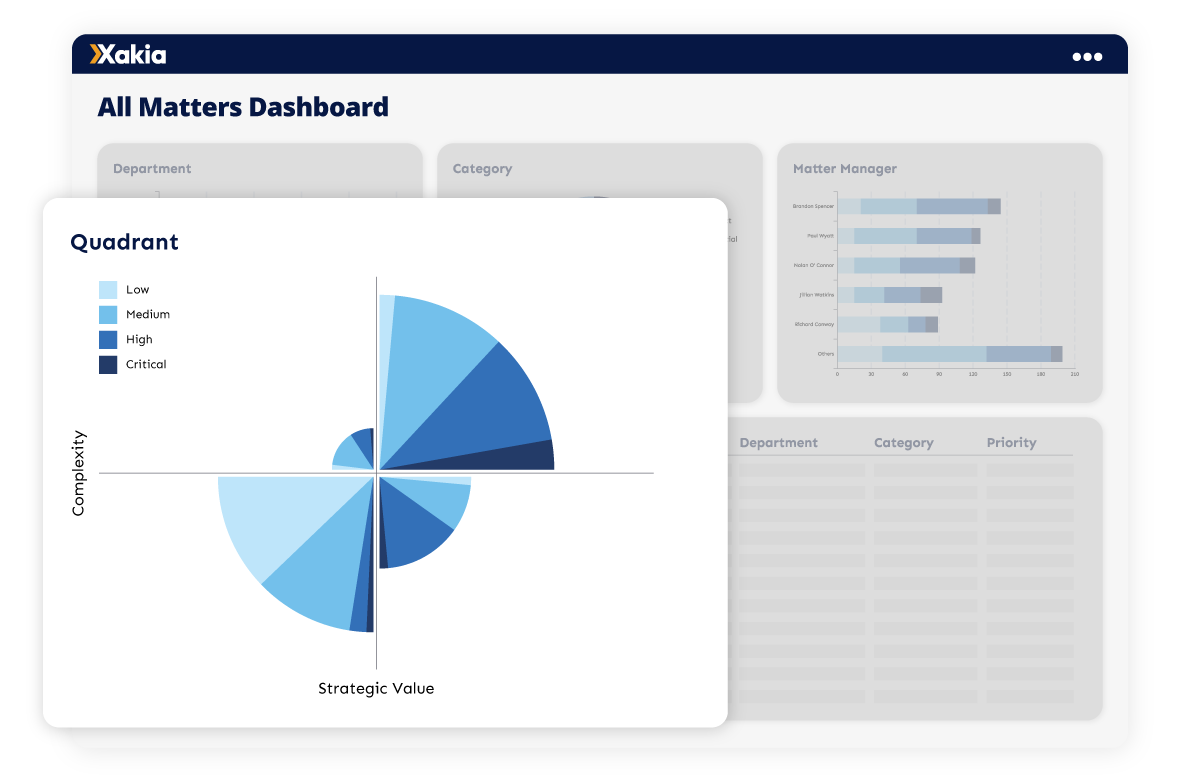
Who is doing the legal work?
How big is the legal work (resource consumption)?
How complex is the legal work?
What is the strategic value of the legal work?
What is the risk profile of the legal work?
Putting these metrics together in a single, configurable and interactive dashboard will help you to communicate in-house legal work nuances to a wide range of audiences and gather key insights to inform Legal Department decision making.
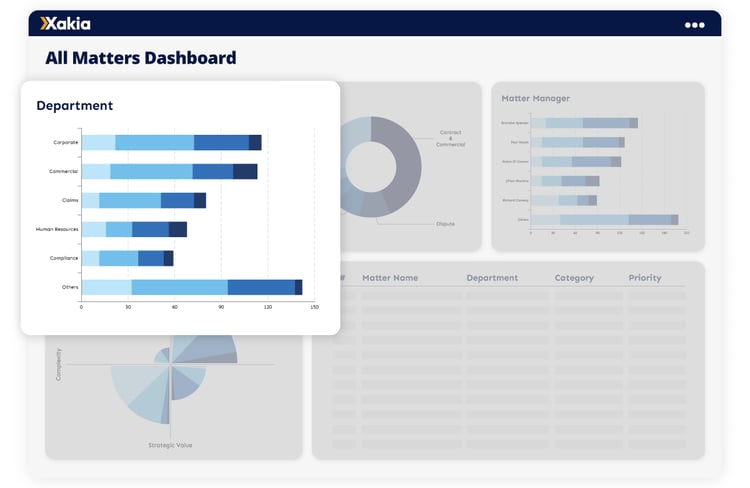
Knowing where legal work requests originate is a powerful metric that helps you align legal resource allocation in a manner that is consistent with your organization's strategic goals, revenue, profit generation and/or risk profile. Visualization of your most common clients communicates this volume instantly.
Imagine, for example, that a department within your organization demands the bulk of Legal Department time, but generates only a fraction of the profit. This needs to be immediately understood so that it can be justified (highly regulated? essential to facilitate other profit generating activities?), alternatively resourced or eliminated.
High level: Reflect your organization's reporting lines for easy recognition and alignment with business goals and reporting. This might be along geographic, functional or product lines.
Nuance: A closer look at the origin of legal requests might see you dig into sub-Departments and even down to the level of the individual making legal requests. If you have a 'frequent flyer' who is asking repetitive questions, there is great power in identifying this through the data to implement automated solutions, accommodate self-help tools or deliver improved training. A data visualization will make sure it sticks out like a sore thumb!
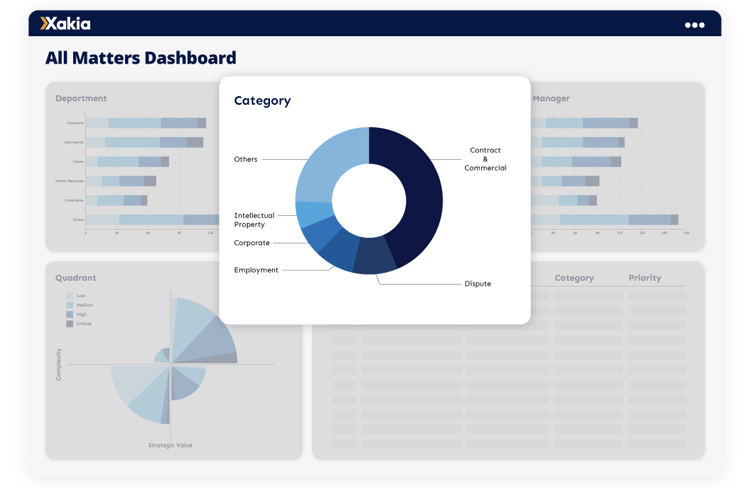
At the core of communicating the work of a Legal Department is to identify WHAT they are doing. Work can be categorized and if necessary, broken into sub-categories, to visualize and quickly identify the biggest substantive areas of law that draw on your legal team resources.
High Level: It is important to keep this simple: an over-fractionalized set of categories will fail to identify where the big blocks of work are being done, and where the biggest impact efficiency gains will be. We recommend 10 categories of legal work for an impactful visualization of work profile.
Nuance: Sub-categories of work allow you to understand not just the quantity of contracts, but the types of contracts that are consuming your valuable legal resources. A 10x10 category set provides sufficient nuance of the work without over-complicating the communication tools that legal data analytics provides.
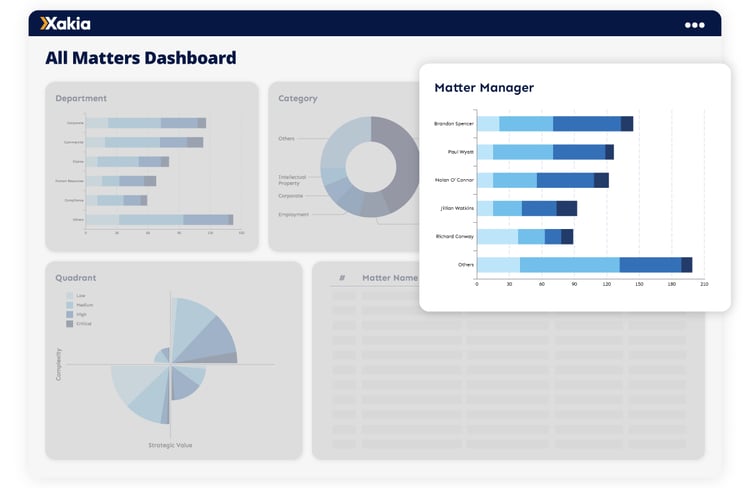
There are several ways to categorize your resourcing solutions, but the ultimate goal is to understand where the heaviest lift takes place, and to understand where there might be a mis-match between the work that is best suited to each resource.
High level: Understand whether your work is being done internally, externally or via an automation tool (either partially, or in full).
Nuance: If you are part of a larger team, you may want your legal analytics to detail the matter management by different 'Groups' within your Legal Department. Broken down even further, you may want to know which of your team members are juggling multiple (too many!?) requests, and the work profile of those requests.
In a world of high automation and agentic AI, you may also want to understand "what" is doing your work. This goes to a question of resourcing solutions ... and yes, your dashboard should look at that too!
Not all legal matters are created equal, some are more equal than others. In matter management, you need to understand - at least at a high level - the resource intensity of the work being done by your Legal Department. Is it a "quick tick and flick" or a major project that involves many hours over many months?
High level: Understanding your largest legal matters is useful and important, but aggregating all legal work in a way that visualizes the distribution of your resources can be extremely valuable, and the biggest opportunity to identify efficiency improvements.
Nuance: To understand work distribution across work category / department / risk profile is critical to the securing productivity improvements. Ensure that you can understand both legal work size AND each of these nuances in your In-House Legal Department dashboard.
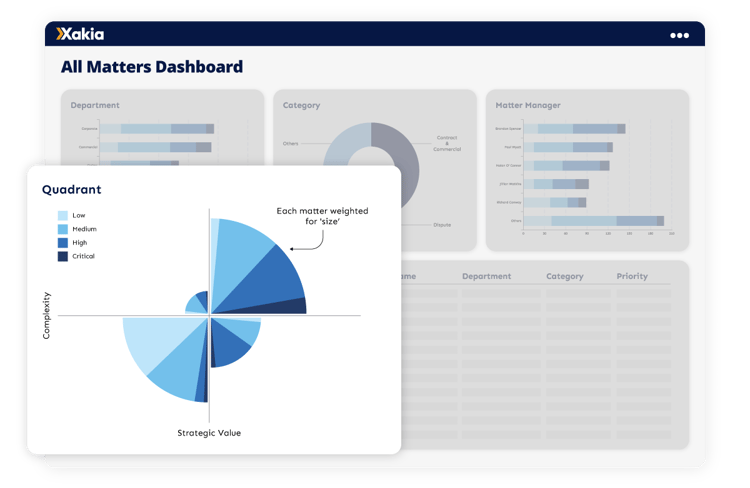
This is one of the two most nuanced parts of legal work, and arguably difficult to depict on a Legal Dashboard. Yet a simple 'rating' out of 10 can give you an instant understanding of where a legal matter sits on the scale, and the corresponding level of expertise or seniority required to resolve the issues involved.
High level: Understanding the concentration of complex work (top half / bottom half of quadrant) will help to gauge the resourcing required for the work of the in-house legal team.
Nuance: High concentrations of complex / non-complex work can indicate exciting opportunities for resourcing alternatives. If you have categories of work that show consistently complex work, recruiting or retaining a specialist in that area of law can reap benefits. Alternatively, low complex work may indicate repetitive, automation-ripe workloads.

In-House legal teams are most effective when they concentrate their matter management on the right hand side of the Xakia quadrant - where the strategic value is highest.Work that is individually less strategically impactful cannot be ignored - much of this is business as usual / keep the lights on type work. However, routine work of this nature may be considered for self-serve tools, document automation or process systemization. This will liberate your in-house legal resources for focusing their time and energy on the more strategically impactful work.
High level: Using a 0-10 scale, a visual communication of the focus of legal resources will demonstrate the prioritization of strategically impactful work.
Nuance: Drilling down into the strategic value for legal work being done for a specific business unit, by category, or for particular team members will add an additional layer to the legal data being depicted, and give rise to practical ideas for productivity improvements. That bottom left quadrant is a golden opportunity to consider automation and AI solutions for improved cost and time efficiency.
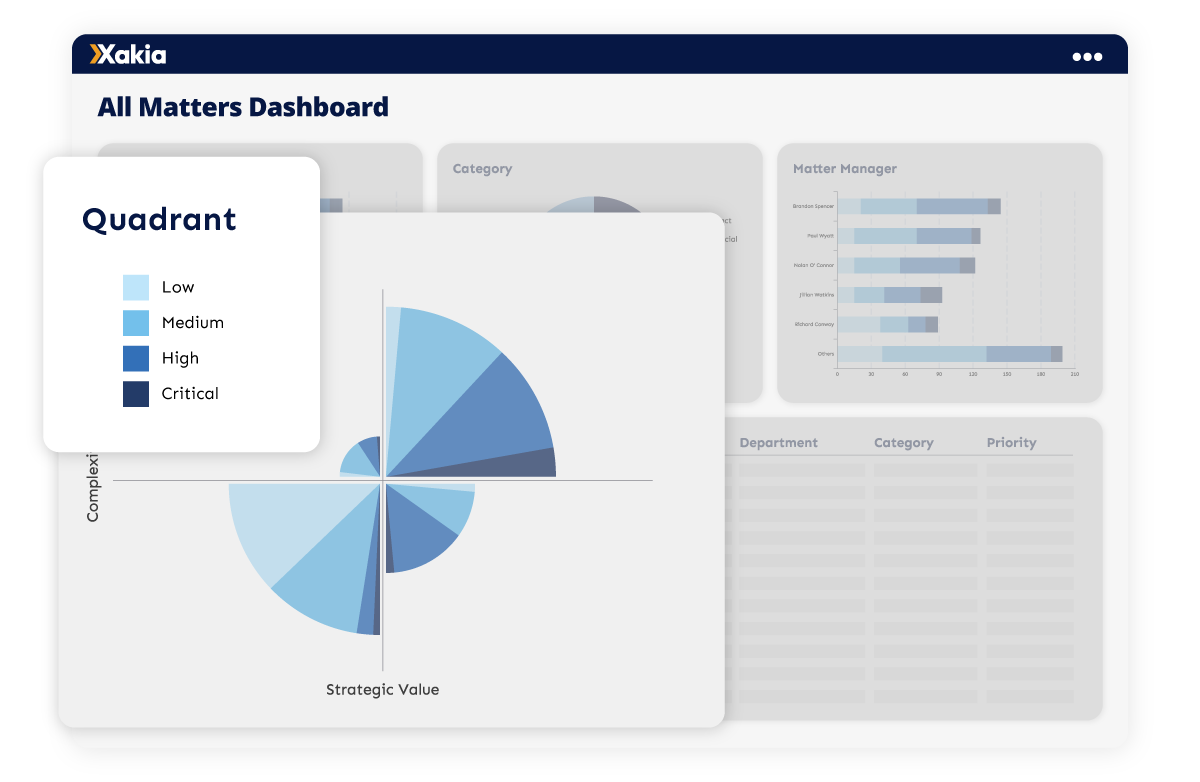
A risk rating on in-house legal work - or a priority rating if you prefer - can give a quick visual depiction of the 'hot spots' that require attention within an organization.
High level: Running 'risk' or 'priority' across all parts of your dashboard will give you an immediate visual prompt (by color) for these hot spots - by department, category, resource and quadrant.
Nuance: Breaking down each risk level will prompt immediate action, helping you to prioritize the highest risk matters with strategic impact. Similarly, the de-prioritization of low risk matters with little impact will potentially facilitate a pragmatic decision about the need to address those at all, and free up time within your Legal Department.
The seven key metrics for a Legal Department dashboard are powerful in their own right. Together and in a myriad combination of metrics, they provide every General Counsel and senior legal leadership team member with a visualization of the complexities and nuances of their legal matter management.
If a Legal Dashboard tells a thousand words, then the combinations of metrics within an interactive dashboard will tell millions or words and communicate to both legal and non-legal audiences the value of the In-House Legal Team, and the endless opportunities for greater productivity.
To learn more about Xakia's in-house matter management and legal analytics software - purpose built for teams of 2 to 20 - and how it can help you manage your small legal department, get in touch with the team today for a demo OR start your free 14-day trial here.

Jodie is an innovator, entrepreneur, and advocate of LegalTech. Her passion to give in-house counsel greater visibility and control to their legal operations is the driving force behind Xakia, an in-house legal matter management platform that is simple, powerful and affordable and services hundreds of legal teams - and thousands of lawyers - around the globe.
Storytelling through legal data analytics can be extremely powerful. Automated intelligent insights power a Legal Department with stories for...
Your in-house legal team is drowning. How do you get a clear understanding of capacity to appropriately (and fairly) assign work? A capacity...
Small in-house legal teams can use reports and dashboards to create a culture of streamlined legal efficiency and delivery, despite limited resources.